Before this tool existed, producing even a rough energy estimate for a dwelling meant a person manually looking the property up on Google Maps, eyeballing its dimensions, scrolling through Street View to guess its construction era and heating system, and typing every parameter into a spreadsheet by hand. It worked, but it didn't scale past a handful of buildings.
BER Automation replaces that manual workflow
end-to-end with a five-phase automated pipeline,
built in Python and developed within the CIRCUS project.
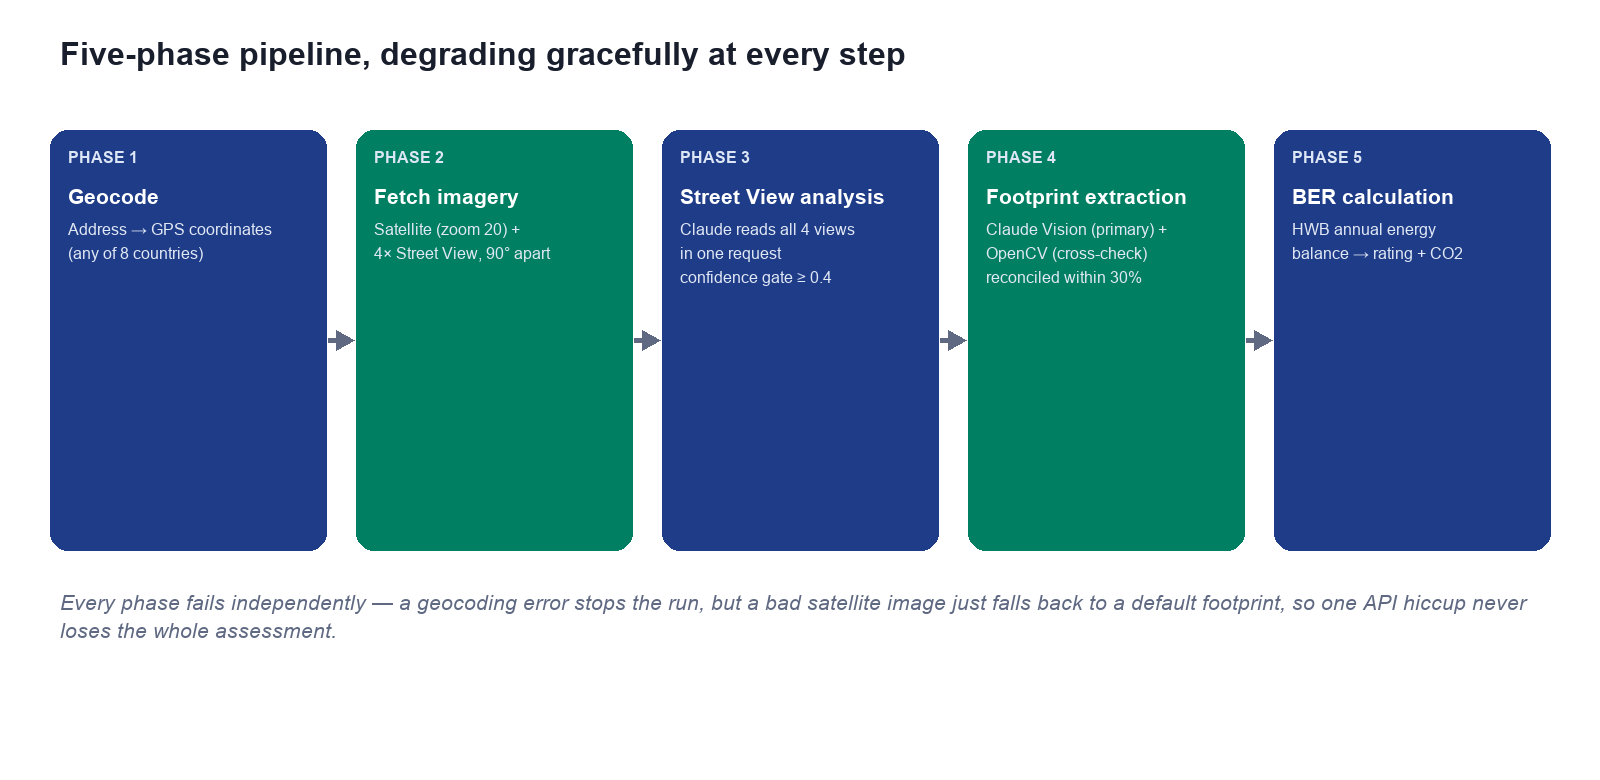
2. Fetch imagery: one satellite photo plus four Street View images captured 90° apart around the building.
3. Street View analysis: a multimodal AI model (Claude) reads
all four angles in a single request, cross-referencing them to spot features
that are only visible from certain sides, an oil tank round the back,
a heat pump condenser, a shared party wall.
4. Footprint extraction: the same AI model estimates building dimensions from the satellite image; a traditional computer-vision method (OpenCV contour detection) runs in parallel as a cross-check. When the two agree within 30%, confidence goes up; when they disagree, the AI result is trusted; if the AI fails outright, the computer-vision result is used as a fallback.
5. BER calculation: a physics-based annual energy balance (the HWB method) turns the building's geometry, construction era, and heating system into an indicative energy rating and CO₂ figure.

Design choices worth sharing
A few methodology decisions turned out to matter more than expected, and may be useful to other partners building AI-assisted or data-scraping tools of their own:
Graceful degradation over hard failure.
Each of the five phases can fail independently without crashing the whole assessment,
a bad satellite image just means the pipeline falls back to a sensible default footprint rather than aborting. For a public-facing community tool, "always return something
useful" beat "fail loudly."
Confidence is gated, not trusted blindly.
AI vision output is self-reported and not independently calibrated, so the pipeline only acts on a classification once its stated confidence clears a threshold (≥ 0.4); below that (a hedge-obscured façade, for example), it falls back to conservative defaults instead of guessing. Any pipeline that feeds LLM output into a downstream calculation should budget for this kind of gate.
Cross-referencing multiple viewpoints in one request
beats stitching single-image calls.
Sending all four Street View angles to the model together, rather than analysing each image separately, let it reason across angles the way a human surveyor would noticing that the tank visible from the side belongs to the house whose door is visible from the front.
Country-specific data made the tool CIRCUS-wide, not Ireland-only.
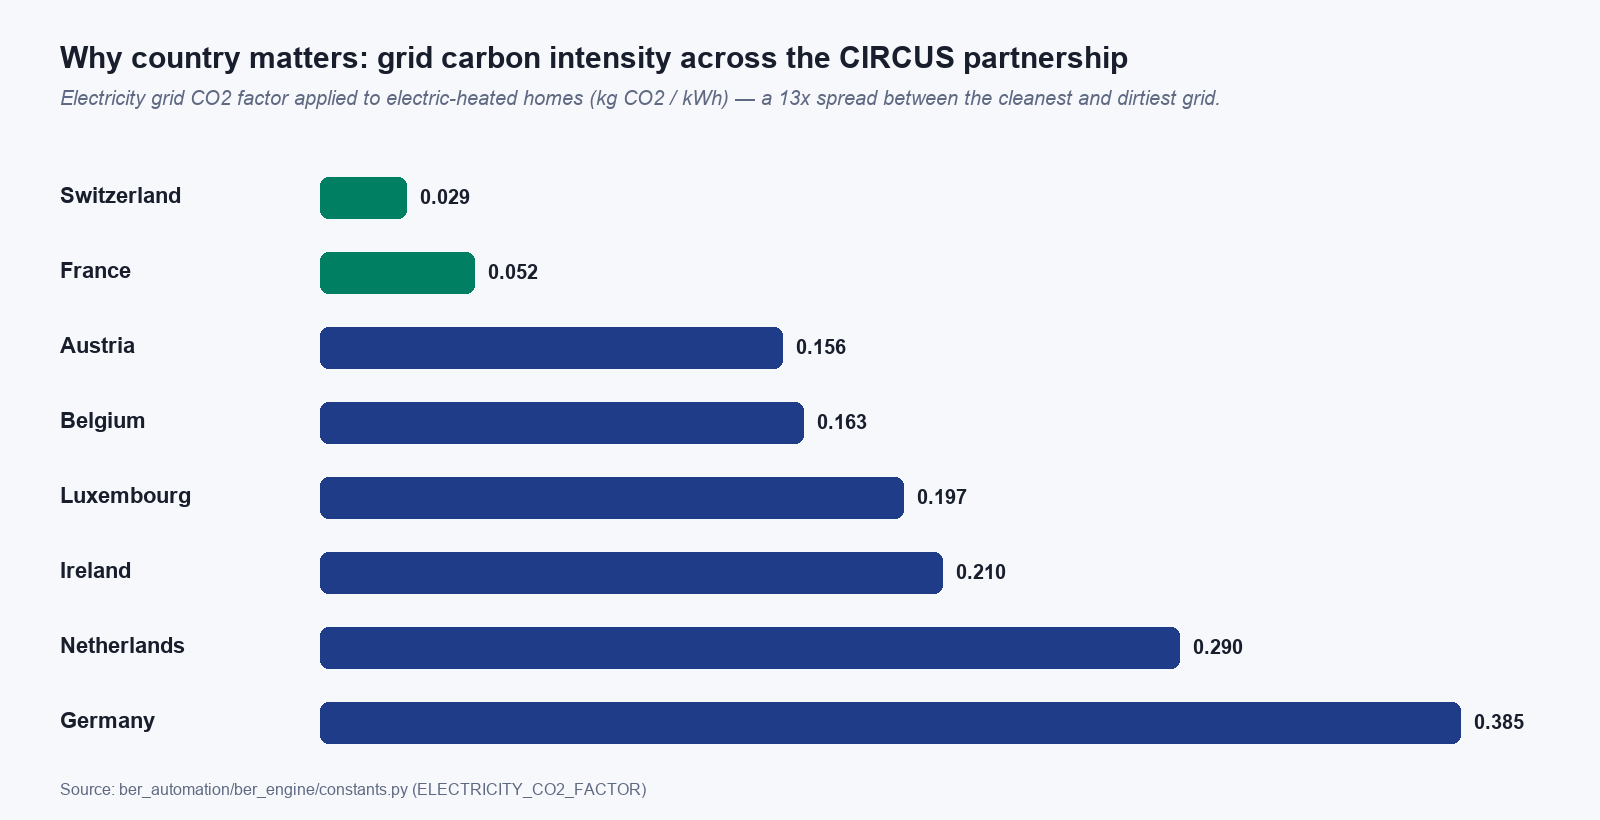
Climate data (heating degree days), electricity grid carbon intensity, primary energy factors, and each country's own certificate scale are all keyed by country, see image below, for how much the electricity grid factor alone varies (a 13× spread between Switzerland's low-carbon grid and Germany's).
The specification is explicit that this tool uses the simpler HWB annual-balance method rather than any country's official certified methodology, that buildings are modelled as simple rectangular boxes, and that footprint accuracy depends on satellite image quality. It is a screening tool, not a substitute for a certified assessment and being upfront about that distinction is, we think, itself a useful lesson for any partner building a similar rapid-assessment tool: communicate what a first-pass AI estimate is and isn't good for, clearly and early.
The full technical specification — architecture, data model, formulas, and known limitations — is attached as a PDF for partners who want to adapt the same approach.