Achieving Europe's energy transition requires more than ambition—it depends on making informed decisions about where renewable energy can be developed. Identifying suitable locations for solar energy is therefore a crucial first step.
Within the CIRCUS project, Karlsruhe Institute of Technology (KIT) developed a Geographic Information System (GIS) model that helps identify promising areas for solar deployment. By combining technical, environmental and regulatory criteria, the model supports more transparent and evidence-based decision-making. To further increase its practical value, the model has evolved into a participatory Public Participation GIS (PPGIS) tool, enabling local stakeholders to actively contribute to the planning process.
Exclusion and Suitability Criteria
Across Europe, exclusion criteria are broadly aligned and reflect the need to protect food production, biodiversity, landscapes and natural habitats. In addition, safety buffers around infrastructure and residential comfort zones must be respected.
For these reasons, the model excludes built-up areas, biodiversity and nature conservation zones, forests, water bodies, watercourses, infrastructure with associated safety buffers and, depending on the application and regional context, non-permanent arable land (for Agri-PV) or high-quality arable land (for ground-mounted PV).
Although these principles are common across Europe, each country has its own regulations and priority areas. Wherever possible, the KIT model incorporates these national differences.
Data Acquisition Challenges
The model depends on geospatial data, but in some regions the most accurate datasets are commercially available. Because the KIT tool is designed as an open-access model, it relies on freely available data instead.
Differences in resolution, format and data quality across these datasets can reduce the spatial accuracy and consistency of the model outputs.
Regulatory Context
Regulatory frameworks differ across European countries and continue
to evolve in response to local challenges. In many regions, limited grid-injection capacity has reduced support for large-scale solar installations, increasing the relevance of energy sharing.
This is particularly visible in the Netherlands, where energy sharing has become a more prominent approach.
Regulatory changes also require continuous updates to the model. In Germany, for example, several revisions of the Renewable Energy Act (EEG 2017, 2021 and 2023) have required the tool to be adapted accordingly.
Because regulatory conditions define the selection criteria, different frameworks naturally produce different results. Scenario analyses confirm that model outputs depend strongly on these assumptions. This highlights the importance of using the PPGIS model directly within energy cooperatives, enabling users to adjust criteria themselves and evaluate identified sites through a transparent decision-making process.
Differences between KIT Model outputs and planning documents
Discrepancies were observed between KIT model results and official planning documents.
In France, some areas designated in national plans fall within restriction zones
identified by the model, demonstrating the strong influence of exclusion and suitability criteria
on potential development areas.
In Emmendingen (Germany), differences between regional plans and the model outputs
can be explained by spatial planning factors, such as water protection zones or
distances to transformer stations, that have not yet been fully incorporated
into regional planning procedures.
Transition to a Participatory PPGIS Tool
To improve its practical application and increase stakeholder acceptance, KIT transformed the GIS model into a Public Participation GIS (PPGIS) tool.
In Emmendingen, workshops involving municipalities, energy communities and farmers supported the validation and refinement of the model. In other regions, stakeholders can contribute by commenting on proposed locations through editable feedback forms embedded directly within the web application.
The PPGIS tool is available in two forms.
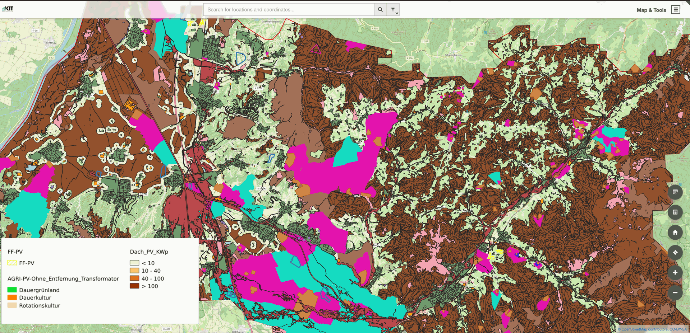
Level 1: Public viewer
This browser-based interface is designed for non-expert users. No installation is required, allowing users to easily navigate the map, inspect polygons and access key information such as area size, estimated energy production and land-use classification.
The web application was developed at KIT using QGIS Cloud Premium, making the map publicly accessible online.
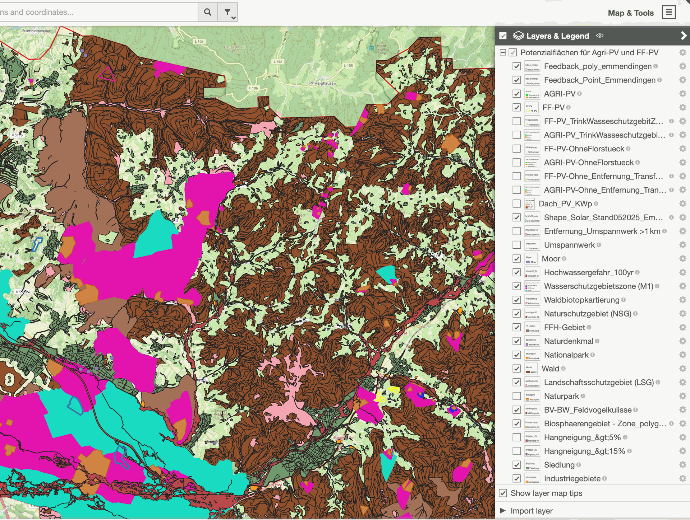
Level 2: Advanced user interface
The advanced interface is designed for users with general computer literacy and experience working with software such as QGIS.
These users can open project files, adjust parameters such as buffer distances, load input datasets and perform analyses directly through the interface.